5.1 INTRODUCTION
This chapter contains detailed examples showing the application of the system described in chapter 4. The examples illustrate various aspects of the music recognition problem, including staveline-finding, segmentation, the processing of some handwritten fragments, dealing with a multi-stave system and the production of output in the form of M.R.L. data. Initially, printed (i.e. engraved) music extracts were used as source material, but the occasional use of handwritten material served to illustrate, and help enhance, the robust nature of the system. Also it was found to be convenient to write tailored extracts including the appropriate features required for testing the system at a particular stage of development. Such artificial material was to some extent constrained, however, so that the development of the system was not diverted into solving problems which normally only occur in handwritten music. The variations which commonly occur in engraved music due to poor print quality do to some extent correspond to those inherent in handwritten music. For example, variations in thickness and straightness of lines (stavelines, notestems, etc.), different shapes of solid noteheads and multiple beams which run together. The illustrations of original engraved and handwritten material are reproduced life-size, except where indicated, while the examples of run-length encoding and sectioning are suitably enlarged. All
-124-
scanning was done at a resolution of 300 d.p.i..
5.2 WORKED EXAMPLES
Figure 5.1 shows part of the first page of the flute part from the B minor sonata of J. S. Bach published by Peters Edition. The faint, fragmented arcs are pencil markings indicating slurs on the original. The music content of the image includes numerous beams which obscure portions of stavelines, small-sized notation for appoggiaturas and a cue, and several examples of closely-spaced symbols. Figure 5.2 shows the result of processing figure 5.1 in order to find staveline sections and then removing these from the original image. There are several points of interest in figure 5.2. Due to the clipping of the original image, the bottom staveline of the lowest stave was missing and hence the stave-finding routine was unable to find five roughly equi-spaced and concurrent filaments in order to identify the presence of this (part-) stave. Consequently, no staveline sections have been found in this part of the image. In the image as a whole, the stavelines were nearly all continuous, with only the occasional short break, for example in the middle staveline of the top stave after the crotchet rest. In any case, these have not affected staveline recognition. Most of the symbols have been successfully isolated, including the cue notation. The main exceptions occur where a sharp or natural sign is within close proximity of another symbol, commonly its associated note. Sometimes, this is due to the engraving, because no staveline exists between the two symbols. Otherwise, the short fragment which is present has formed a section with average thickness above the threshold set for
-125-
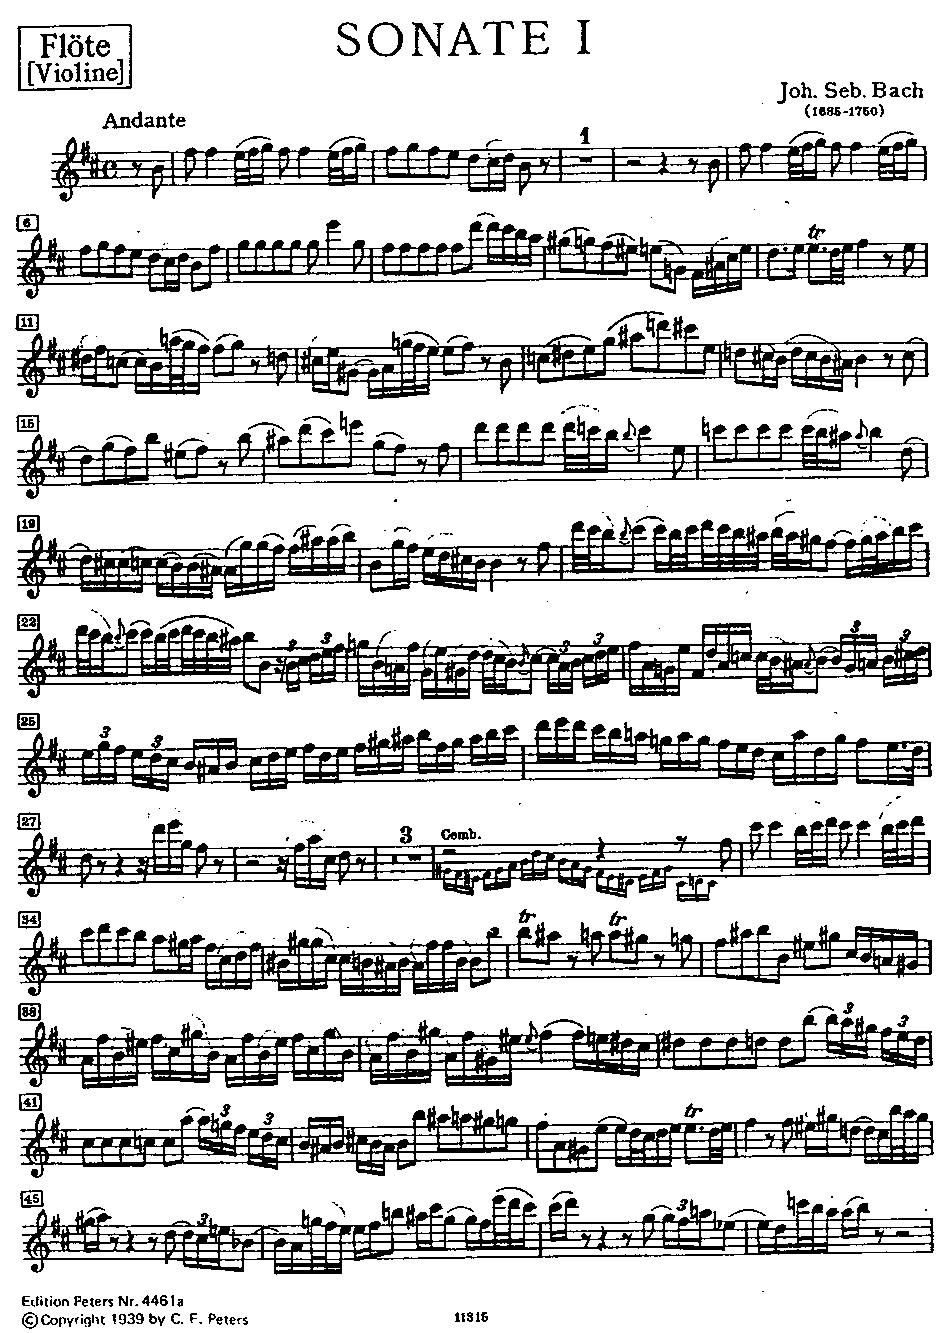
Figure 5.1 The opening page of the B minor flute sonata of
J. S. Bach - reproduced with permission of Peters Edition. (80% life-size).
-126-
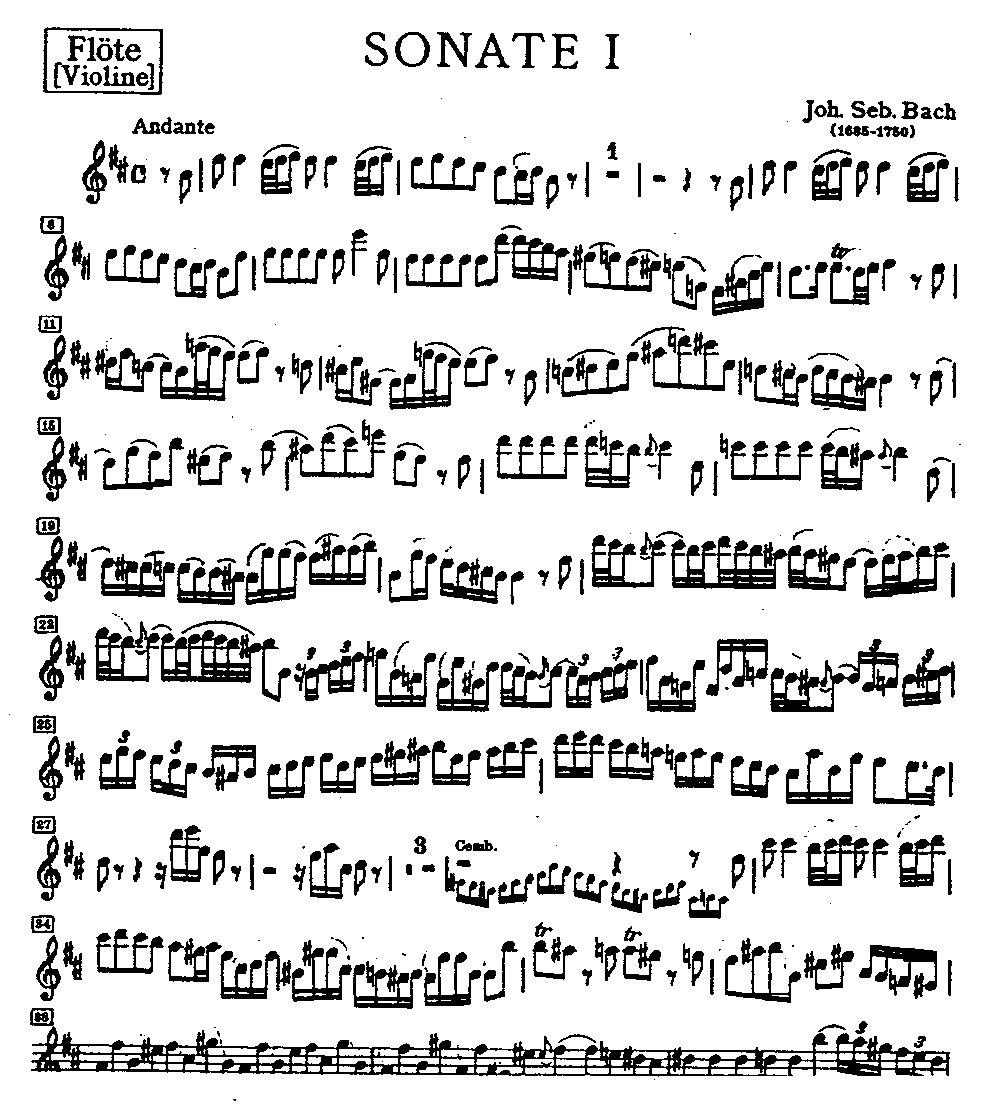
Figure 5.2 An image of part of figure 5.1 processed to remove staveline sections.
-127-
staveline thickness, often because it has run into one of the cross-strokes of a sharp sign. The line-tracking has been misled by the slightly-sloping beam in the last bar of the lowest complete stave where it has followed the beam rather than the true staveline - this would in turn have affected the beamed group recognition routines. The distortion of isolated symbols as a result of staveline section removal can be seen to be minimal, not beyond the possible effects of noise in an original image. Through the use of a line-tracking rather than a global approach to staveline processing, symbols outside the bounds of the stave have been left untouched.
Figure 5.3 shows a page from the 'cello part for the 'Hamburg' flute sonata of C.P.E. Bach. This is the page from which the illustrations for chapter 4 were taken (although in that case scanning was done at 400 d.p.i.). Figure 5.4 shows the image with the staveline sections removed. This shows that clear symbol isolation has been achieved in the main but also illustrates typical cases of part of a particular symbol coinciding with a staveline, i.e. the top of the bass clef symbol. In several occurrences of this situation the section formed where the bass clef symbol merges with the top staveline has a sufficiently high average thickness to exceed the threshold for maximum staveline thickness, resulting in preservation of the connectivity of the symbol. In other cases this is not so and the bass clef symbol is fragmented. This is not too much of a problem for the recognition stage as models for both versions of this particular symbol can be stored and applied, in conjunction with a procedure for detecting and associating the requisite pair of dots.
-128-
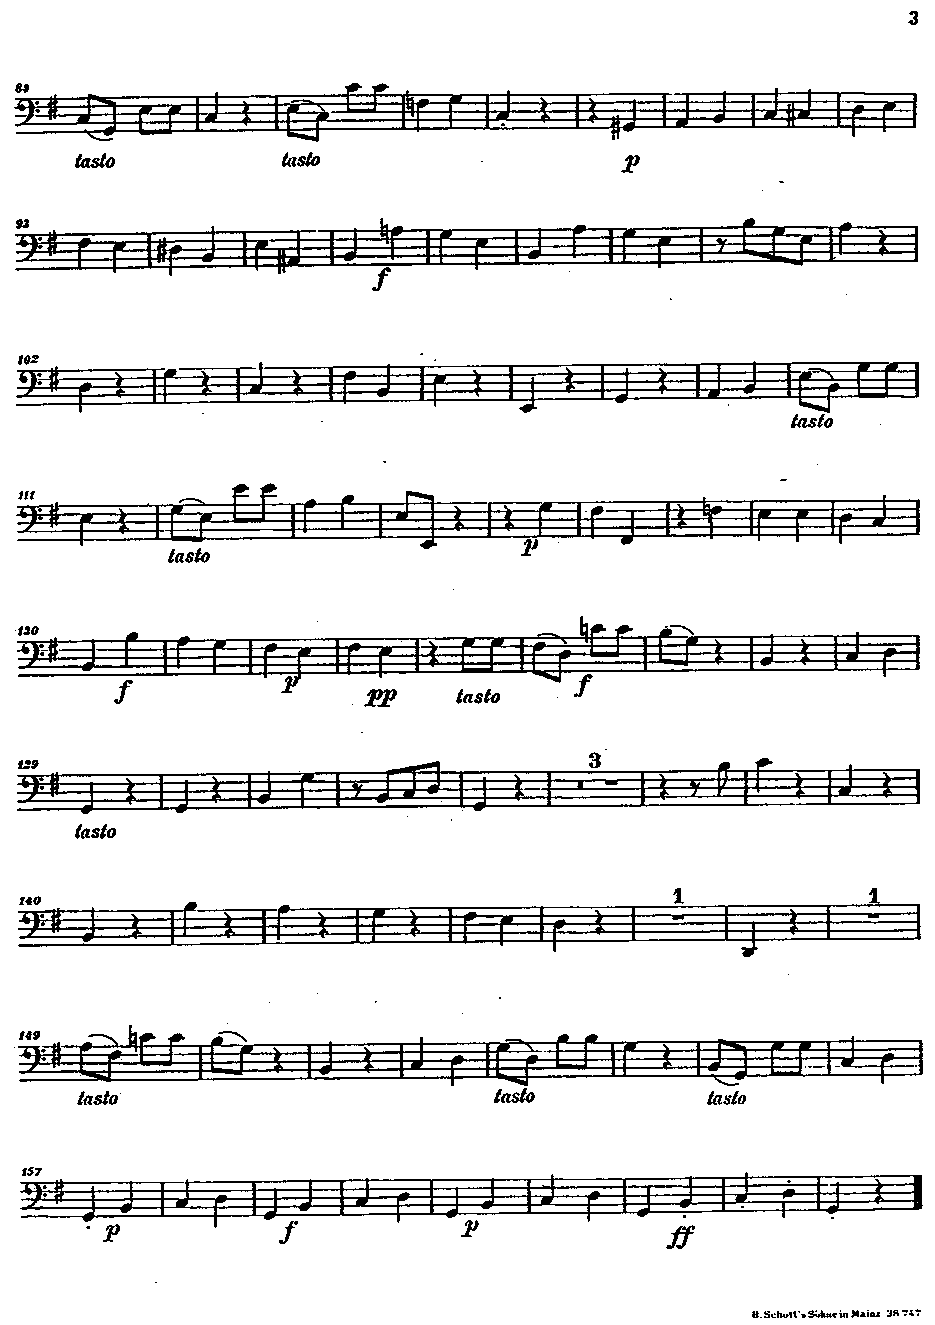
Figure 5.3 A page from the 'cello part to the 'Hamburg' flute sonata of C. P. E. Bach. (80% life-size).
-129-
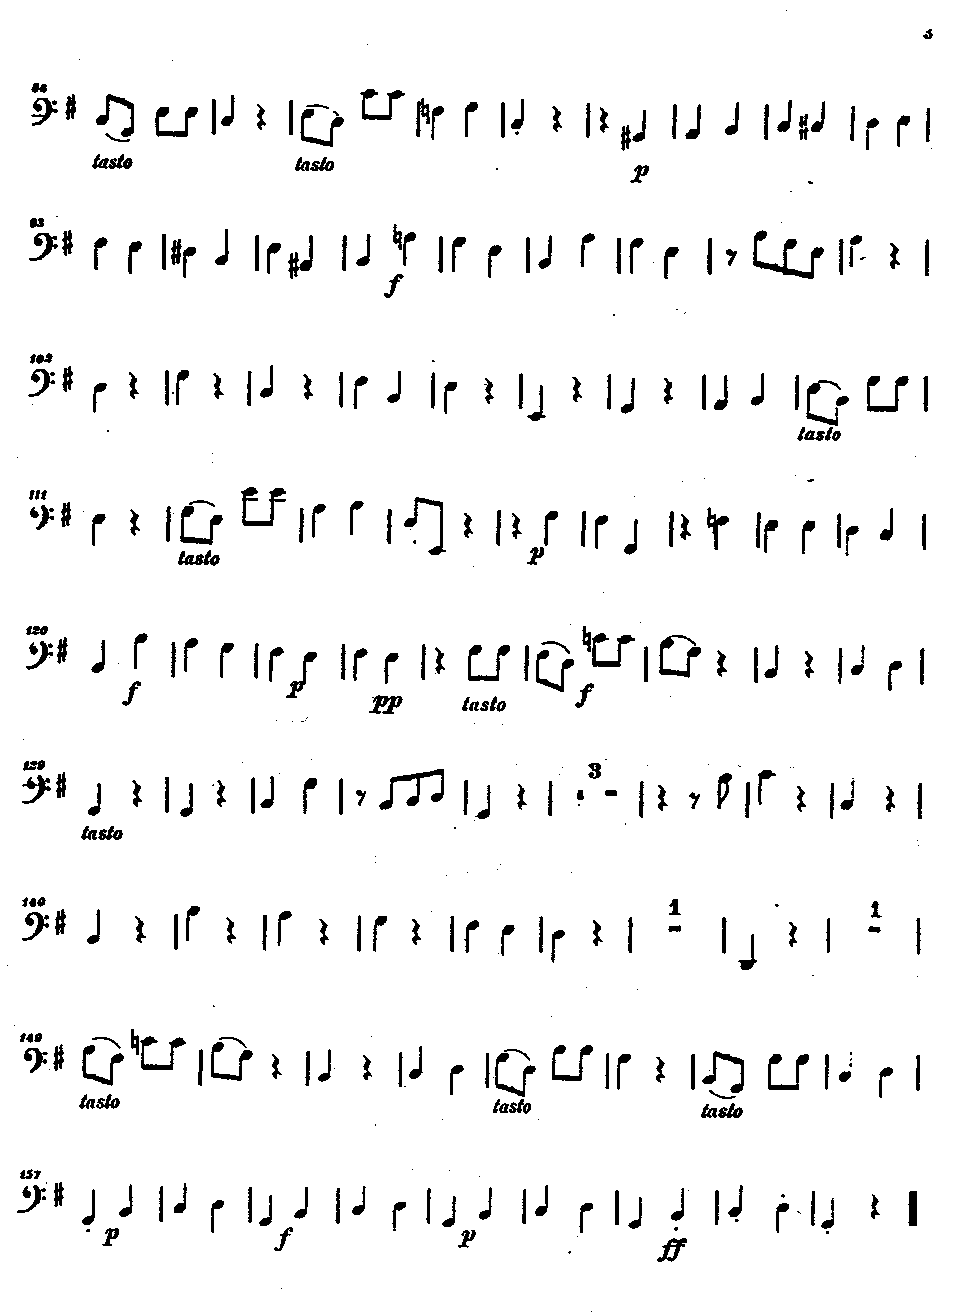
Figure 5.4 An image of figure 5.3 processed to remove staveline sections.
-130-
Figure 5.5 shows an extreme case of stavelines being obscured by beamed note groups, in this case demisemiquavers. It can be seen in figure 5.6 that the line-tracking procedure has succeeded in following the stavelines correctly even in the situation where a beam coincided over its entire length with a staveline. While previous examples have shown the staveline-finding strategy to be a successful one, this example is stretching the line-following approach to its limits. An alternative approach might use a filter (i.e. a global operation) for removal of short vertical runs of pixels, given that the threshold for this has already been set by the filaments found. This would have to be localised in some way, to avoid affecting slurs and other thin symbols, possibly by making use of the positional information available regarding filaments. Perhaps a combination of line-following and then a back-up check using a filter of the above type might be useful. Another possible technique (the one favoured for future inclusion in the system) would involve a 'clustering' approach, which, intuition suggests, resembles the technique used by the human vision system. Here, links would be made between filaments, and a clustering technique applied to group together filaments from a common stave, in the process isolating hairpins and other extraneous filaments. This would also provide a 'structure' which would assist the interpolation process in finding staveline sections which were not categorised as filaments. Alternatively, the sections with average thickness below the established threshold for staveline thickness could be included in the clustering process together with some form of weighting which, in their case, would be lower than that of filaments (the discussion of annealing in Byrd's thesis [Byrd l984] is relevant here).
-131-
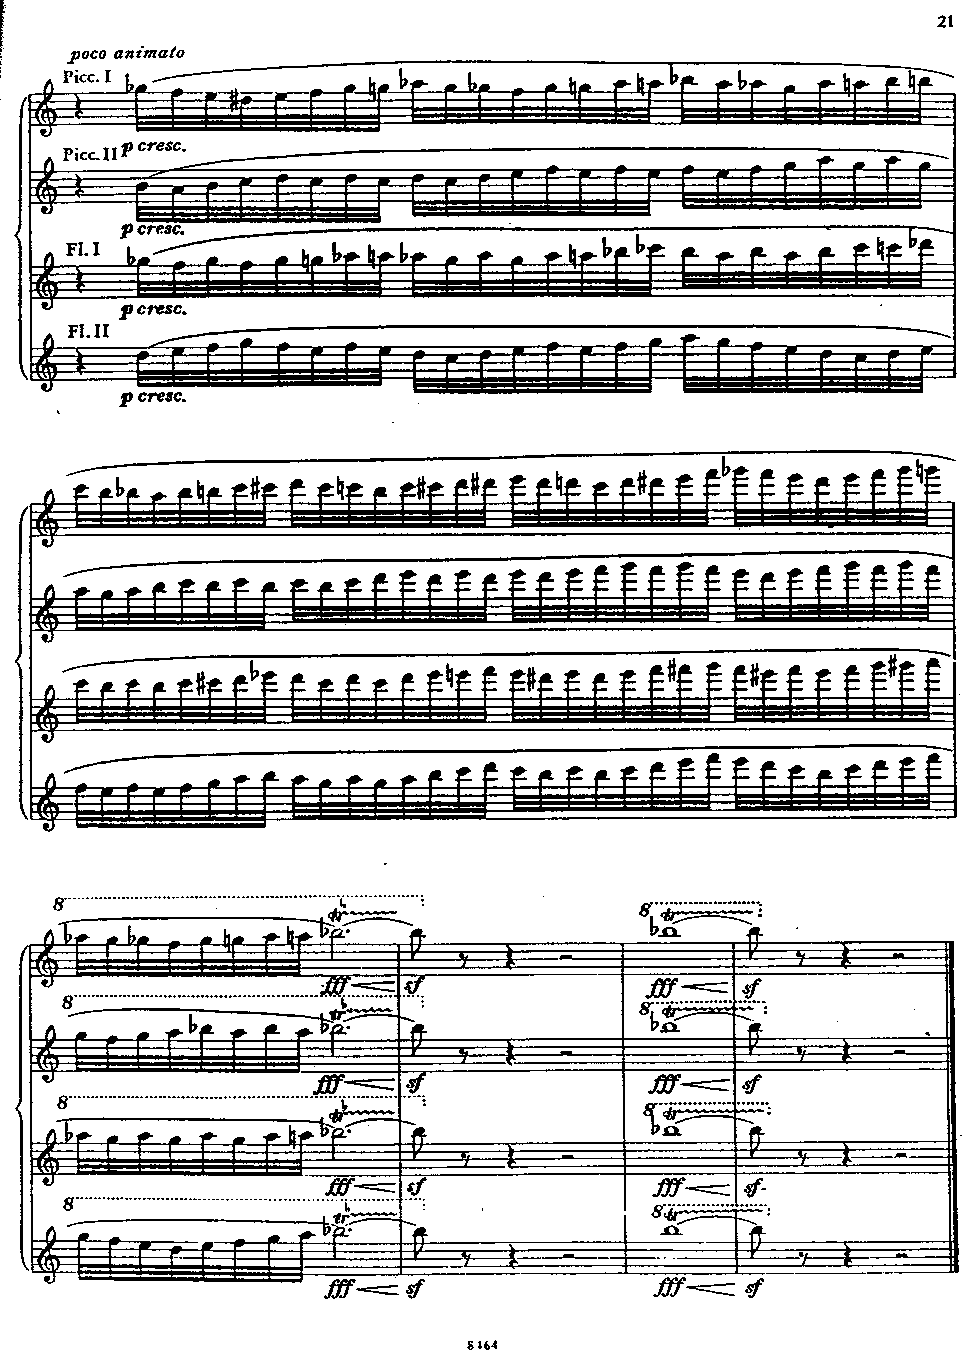
Figure 5.5 A page of orchestral extracts from the symphonies of Shostakovitch - reproduced with the permission of Fentone Music. (80% life-size).
-132-
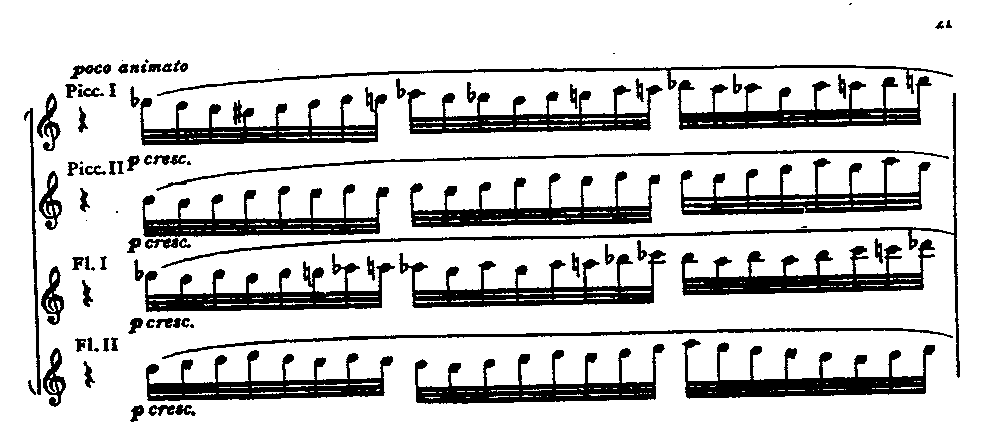
Figure 5.6 An image of the upper-most four-stave system from figure 5.5 processed to remove staveline sections.
-133-
After the symbols had been isolated by the staveline-finding procedure, recognition had to be achieved. Initially, as outlined in section 4.10 (RECOGNITION), a set of models using graph structures and dimensional parameters was constructed. An object in the image being processed could then be compared with the relevant models and, in a large percentage of cases, a match found.
The development of the technique for analysing beamed note groups described in section 4.11 (ANALYSIS OF BEAMED NOTE GROUPS) led to the modification of the above approach. Although the use of graph structure-based models and associated dimensional parameters was to be retained, the availability of a robust method for detecting approximately vertical lines gave this form of symbol component added importance. The following figures provide detailed illustrations of the application of the ideas of section 4.11.
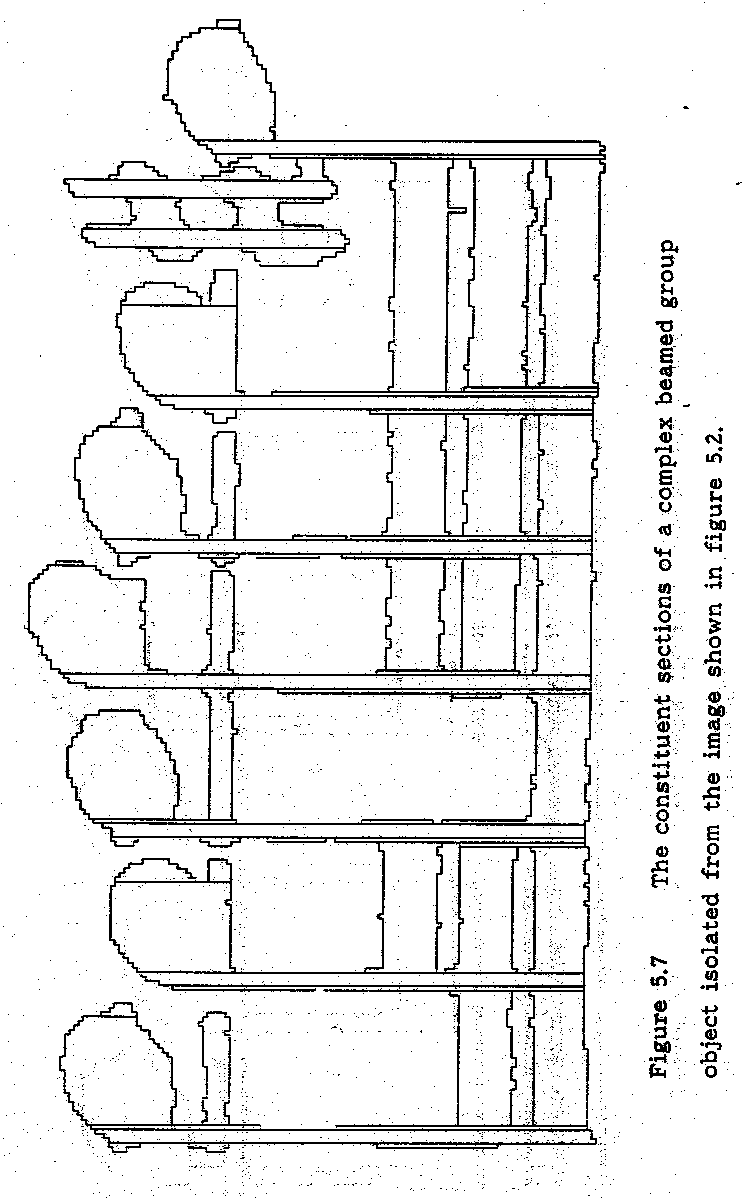
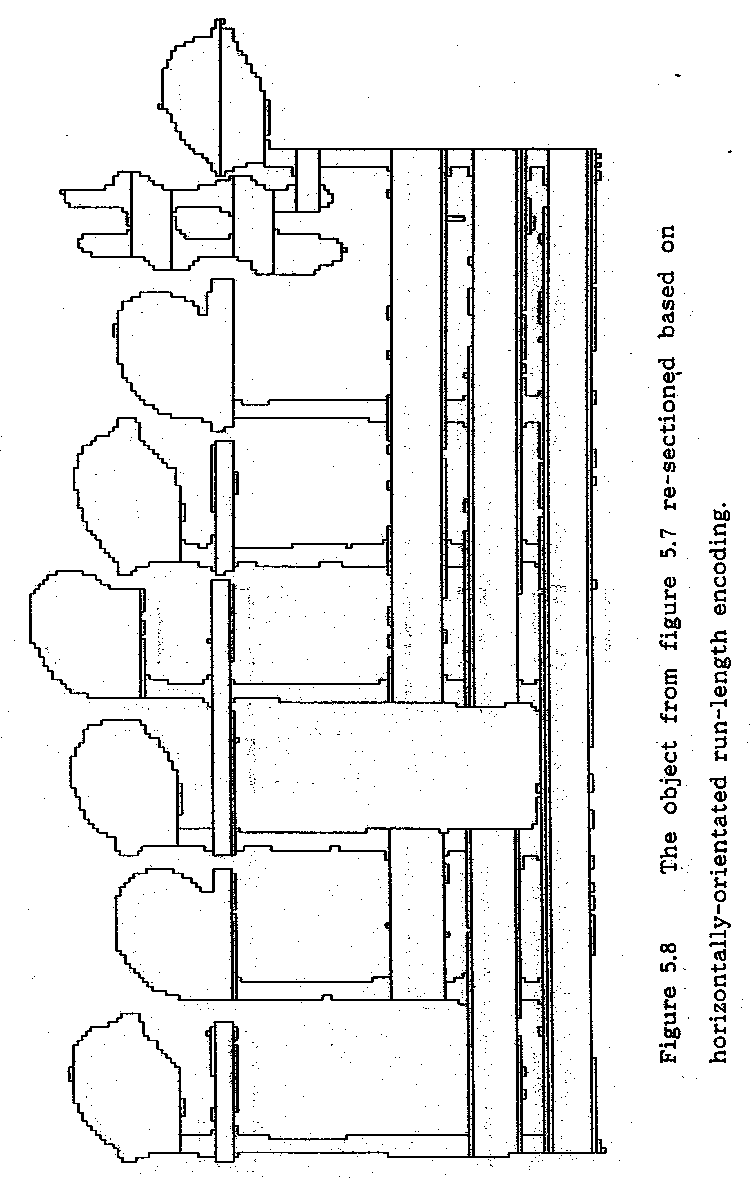
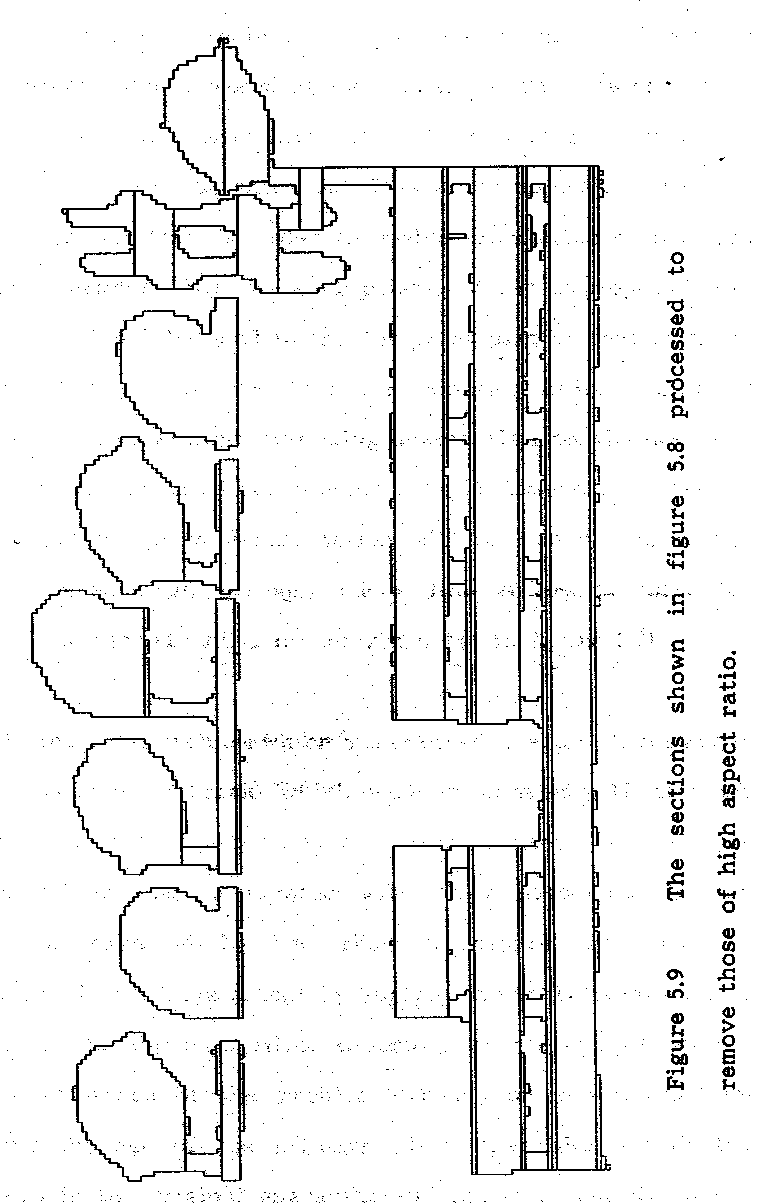
Figure 5.7 shows a complex beamed note group which formed an individual object after isolation from the stavelines. The horizontally-orientated run-length encoding of the object was produced, and the resulting data supplied to the original routine for the production of the transformed LAG (as explained in section 4.11). The resulting sections for the object are shown in figure 5.8. The high aspect ratio sections have been removed, as notestems, to produce figure 5.9. This illustrates the need for several further operations in order to analyse a wide range of beamed note groups. It can be seen that the rightmost notestem has not been identified, due to the value of the aspect ratio
-134-
-135-
-136-
-137-
threshold. In this example the effect is due to the attached sharp sign, but it may also be encountered where a short notestem occurs due to a particular combination of pitches or multiple beams. If the threshold was lowered, notestem fragments located either between a pair of ledger lines or between a ledger line and a notehead would also be extracted. This would necessitate the use of a collinearity test, in order to enable association of multiple notestem fragments with the appropriate note. It is proposed that this approach will be used in the future as part of beamed group analysis. The process required for counting ledger lines by examining a vertical strip extending downwards from the notehead has also been formalised but remains to be implemented and tested. This method for pitch determination will be robust despite the possible absence of various ledger line fragments (see, for example, the second, third and fourth notes in figure 5.9).
The principal problem which has emerged in applying the above method has involved breaks which occur in notestems. These cause noteheads to become separated and hence formed into separate objects rather than integrated with their associated beamed groups, as expected by the above procedure. This can be circumvented to a large extent by applying a vertically-orientated version of the low-pass filter described at the end of section 4.1. The existence of the problem depends on several factors, including the age of the printing plate, the thickness of the notestems in the original engraving and the print-quality of the sample being scanned. Usually notestems are thicker than stavelines and so the former are less likely to break up in the printing process. The example given in figure 5.10 illustrates the
-138-

Figure 5.10 The first three bars of the Allegro from the C major flute sonata of J. S. Bach - reproduced with permission of Boosey and Hawkes.

Figure 5.11 A reconstruction, using the SCORE desktop music publishing package, of the extract shown in figure 5.10. (80% of default size).
-139-
treatment of beamed groups using the above techniques whilst incorporating the problem of fragmented stems. Before it is discussed, the SCORE desktop music publishing package will be introduced, as it is used in figure 5.11, and the following figures, for reconstruction of the musical material.
A brief overview of the SCORE desktop music publishing package appeared in the Appendix to chapter 2. To amplify, it is a package for the IBM PC based on the work of Professor Leland Smith at Stanford University. It uses QWERTY keyboard, mouse or non-real-time MIDI keyboard for input, its own unique internal representational system and produces output on dot-matrix or Postscript printers including compatible phototypesetters. An important facility allows a file containing M.R.L. data to be prepared externally, using a wordprocessor or, in this case, by the recognition software, and then imported into SCORE. The M.R.L. uses a letter and octave number to represent pitch and either numbers (4 = crotchet, 8 = quaver, etc.) or, in some cases, letters to represent rhythm. Beaming information, slur positions and miscellaneous markings (including text underlay) are all entered separately. The vocabulary of symbols is extensive and, in addition, there is a facility which enables the integration of user-defined symbols.
To return to figure 5.10, this shows an extract from the Allegro from J.S.Bach's C major flute sonata. The reconstruction of the musical material achieved using the SCORE package and printed using a 300 d.p.i. Postscript laser printer is shown in figure 5.11. Initially, 10 of the noteheads were separated from
-140-
their respective beamed note groups due to breaks in the notestems (although this may not be the case in the illustration seen here, due to the reproduction process). The vertically-orientated low-pass filtering operation described above removed all but one of these breaks; the one remaining break caused the misrecognition of the second note in the eighth group. Only beamed groups were processed at this stage in order to thoroughly test the new method for their analysis - the other symbols present in the reconstruction were added by default.
In order to encompass fragmented stems with breaks larger than those filled by filtering, the beamed group recognition software would have to include a procedure for associating objects. Where a fragment of notestem existed which was large enough to be identified as such by the vertical line-finding procedure of the beamed group analysis routine, the original image could be searched in the relevant region for the notehead. In the much rarer case, where the stem is broken into several fragments, a more complicated procedure for assemblage would have to be undertaken. This processing option would have to be generally available eventually so that other grossly fragmented symbols could be recombined into meaningful structures. A clustering technique along the lines of the one suggested as a possible approach to staveline fragment association may be suitable. Coping with an image of the poor quality now being discussed would be a tremendous challenge, especially considering that text of such quality would almost certainly defeat existing OCR systems.
Another factor, briefly touched on in section 4.10 is the
-141-
relatively common occurrence of overlapping or superimposed symbols. These need to be separated out by a specific algorithm and it is proposed to start by extracting lines, in any orientation, from such a compound symbol. This would remove barlines, slurs and hairpins - the most commonly intersecting symbols. Similarly, in situations where one symbol becomes inadvertently attached to another (e.g. the sharp signs attached to noteheads in figure 5.2), an approach based on iterative removal of elementary symbols and symbol components is advocated. Thus, by first identifying and removing the notestem and notehead of an individual note, the appended sharp (or similar) sign could then be recognised in isolation.
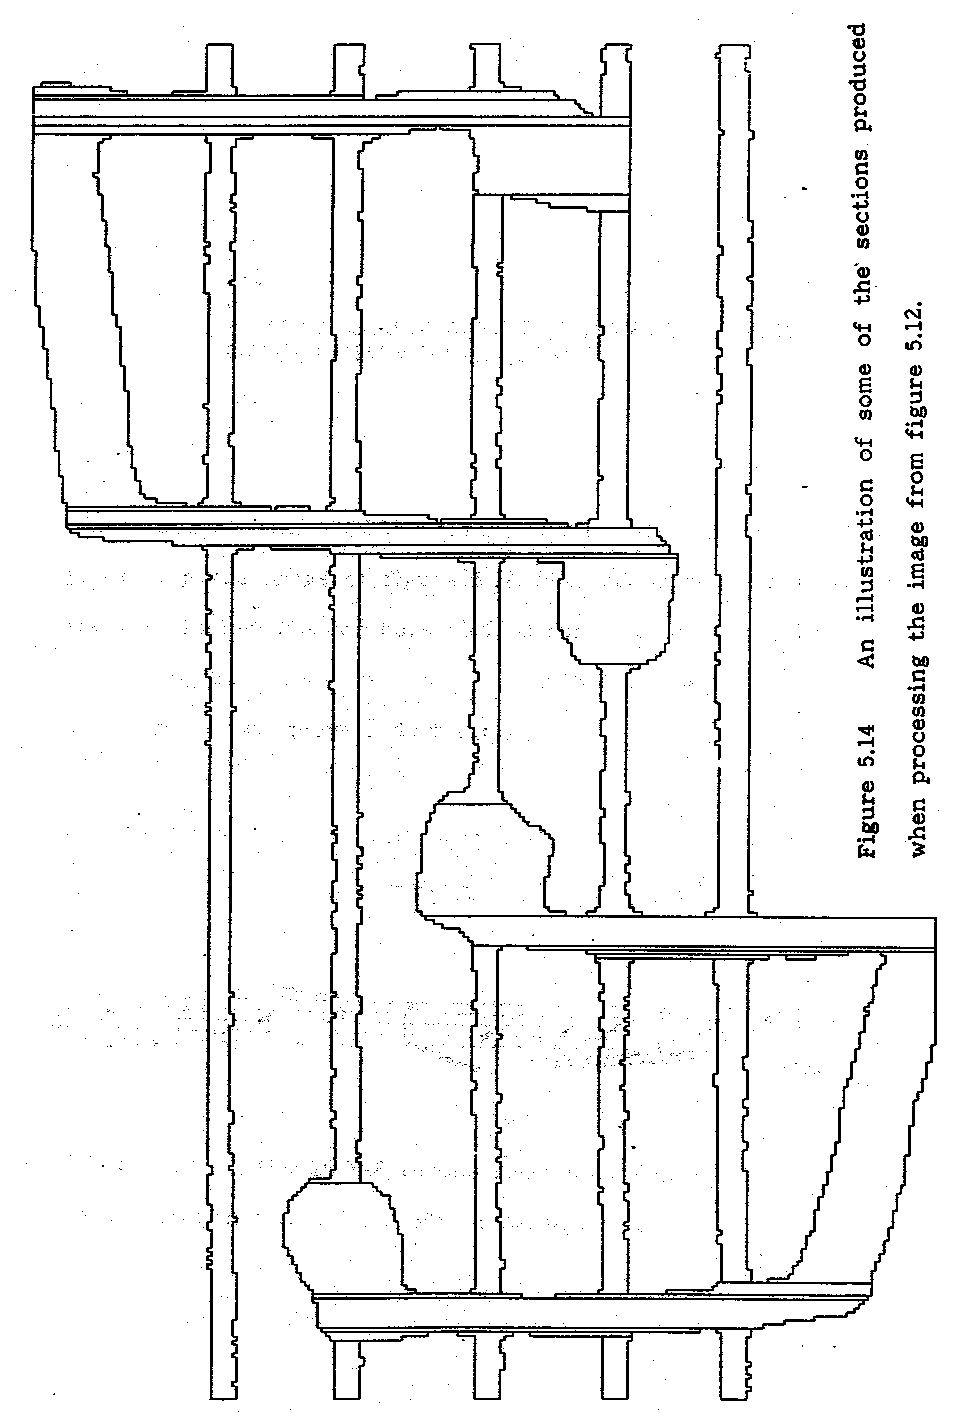
Figures 5.12 to 5.16 show the stages involved in processing a short handwritten extract. The original image is shown in figure 5.12, while the same image with its staveline sections removed is shown in figure 5.13. A fragment of the original image with sections illustrated is shown in figure 5.14. The SCORE M.R.L. data file produced as a result of processing the extract is shown in figure 5.15. The sectioning illustrates the earlier comment that the characteristics of the handwritten extracts used were intended to test the recognition system but not to force extension of its scope to include all handwritten notation. For instance, the variable thickness and straightness of the notestems was a reasonable test which was satisfactorily negotiated by the techniques outlined above, while the shapes of the noteheads were kept reasonably close to those found in engraved notation, something which does not apply widely to handwritten manuscripts. The reconstruction of the extract, obtained using the data file of
-142-

Figure 5.12 A short handwritten extract.
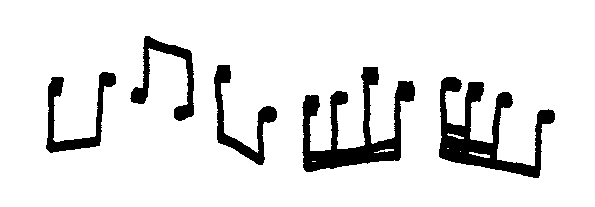
Figure 5.13 The image of figure 5.12 processed to remove staveline sections.
-143-
-144-
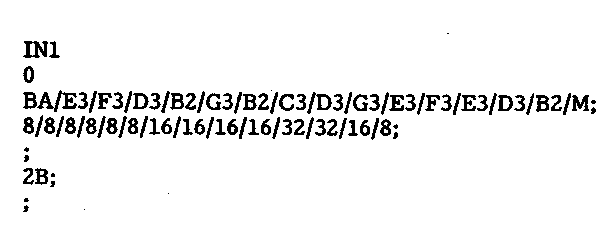
Figure 5.15 The SCORE M.R.L. data file resulting from processing the image of figure 5.12. (The codes not mentioned in the text include BA for bass clef, M for measure (bar-) line and 2B meaning beam notes of duration less than a crotchet together in multiples of two quavers duration.)

Figure 5.16 The SCORE reconstruction of figure 5.12 using the data shown in figure 5.15. (80% of default size).
-145-
figure 5.15, is shown in figure 5.16. This was printed in the same way as figure 5.11.
Figure 5.17 shows a more complex handwritten extract containing a three-stave system. This was used in testing both the beamed group analysis routine and also the ability of the system to cope with objects (the barlines) which were associated with multiple staves. The ordering of the staves, as well as symbols within individual staves, in order to produce the correct SCORE M.R.L. data file, had also to be achieved. The processed version of figure 5.17, with staveline sections removed, is shown in figure 5.18. The problem regarding a part of a symbol coinciding completely with a staveline is illustrated here in each of the three clefs. As stated earlier in this chapter, the bass clef could be recognised regardless of fragmentation, by making available alternative models, while in the cases of the other clefs the bounding rectangle was not affected and this was used in conjunction with positional information to achieve recognition. A rudimentary object association routine (see above regarding assembling fragmented symbols) was used to 'connect' the bass clef components, including the pair of dots. All the other objects were analysed using the techniques described in section 4.11. The barlines were recognised as objects which contained a single vertical line which constituted over 90% of the total area of the object - this allowed for any remaining extraneous noise sections. A list of associated staves was established for each object, containing three entries in the case of each barline and one for each of the other objects. The stave numbers of the staveline sections had previously been sorted so that the staves were
-146-
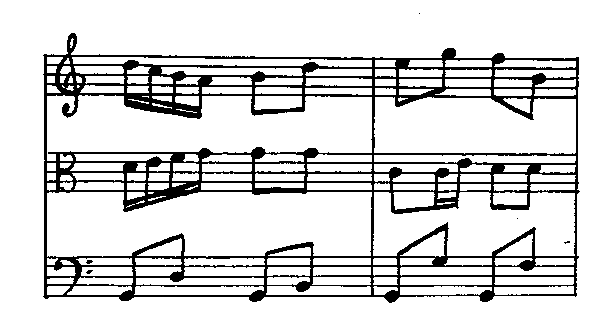
Figure 5.17 A short, handwritten trio extract (three-stave system).
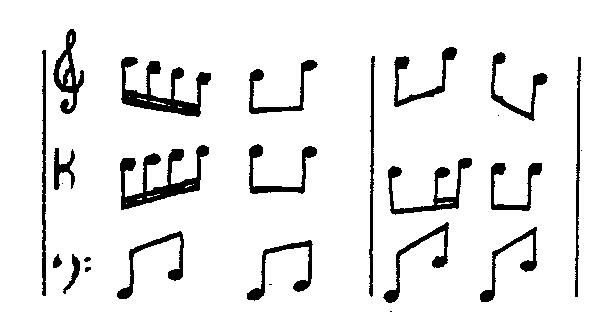
Figure 5.18 The image of figure 5.17 processed to remove staveline sections.
-147-
numbered in ascending order from one, which was the lowest on the page. This corresponded to the organisation used by SCORE. The SCORE M.R.L. data file resulting from processing figure 5.17 is shown in figure 5.19. The three blocks of data corresponding to the three staves can be seen, while the code 'M3' indicates a barline stretching over three staves. The reconstruction of the extract, produced using the data of figure 5.19 appears in figure 5.20.
-148-
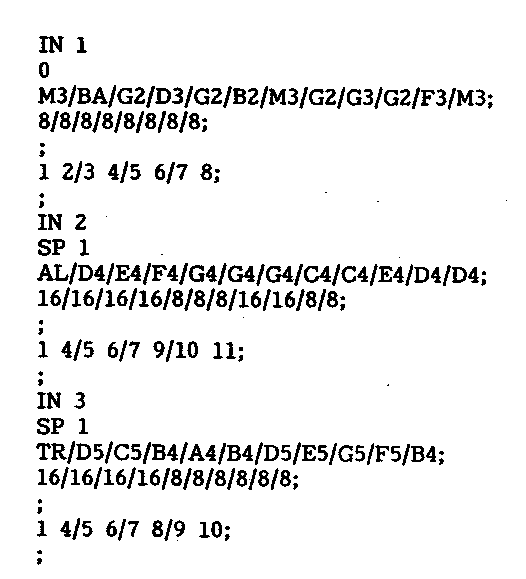
Figure 5.19 The SCORE data file resulting from processing the image of figure 5.17.

Figure 5.20 The SCORE reconstruction of figure 5.17 using the data shown in figure 5.19. (80% of default size).
-149-